Grocery trade strategy
K Group is the second biggest grocery trade operator in Finland. Some 860 K-retailer entrepreneurs ensure good customer experiences for 1.2 million daily customers at K Group’s 1,100 grocery stores. Nearly 800 of the stores also offer online grocery services, supported by express deliveries. Our grocery store chains are K-Citymarket, K-Supermarket and K-Market. Kespro is the leading foodservice wholesale provider in Finland.
The division’s growth strategy is based on store-specific business ideas, extensive utilisation of data, and strong digital capabilities, combined with efficient processes. Online grocery operations support sales in our physical stores. Our strategic investments in new stores and updates to existing ones strengthen K Group’s sales and customer satisfaction. The division aims to further strengthen its market-leading position in Finnish foodservice.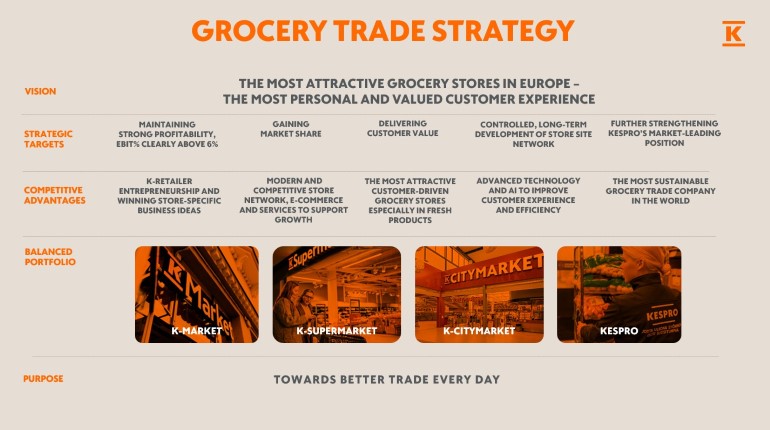
Strategic objectives
- Maintaining strong profitability
- Strengthening market share
- Delivering customer value
- Controlled, long-term development of the
store site network - Strengthening Kespro’s market-leading position
Competitive advantages
- K-retailer entrepreneurs and customer-oriented store-specific business ideas
- Modern and competitive store network, digital and other services supporting growth
- The most attractive, customer-oriented grocery stores especially in fresh products
- Advanced technologies and AI used to improve customer experience and efficiency
- The most sustainable grocery trade company in the world (Global 100)
Business environment
Consumer confidence
- Consumer confidence still low
- Price still important
- Offers and campaigns continue to be important
- Grocery trade market growing, signs of demand growing for high-quality products
Demographic changes
- Population ageing, concentrated in growth centres
- Growing number of smaller households
- Store network and selections must reflect the changes
Consumer megatrends
- Growing importance of convenience and eating out
- Increased focus on wellbeing for some consumers
- Important to address individual needs
Importance of data, AI, and digitalisation
- Growing role of data and digital services improving relevance
- Digitally-assisted sales growing
- New business formulated around data and digitalisation
Competition
- Continued high level of investments also from competitors
- Competing with both price and selections in physical stores and online
- Competition tightening further in online sales for home and speciality goods

Read more in Kesko's Annual Report.
Market
In 2025, the Finnish grocery retail market (Nielsen Shop Directory and Kesko’s own estimates) totalled some €24.1 billion (incl. VAT), representing an increase of some 2.5% (Finnish Grocery Trade Association). The growth of the total grocery trade market indicates gradually strengthening consumer confidence. In recent years, the market has been very price-driven due to muted consumer confidence and high level of household savings. Signs of improvement have been visible since the summer of 2025. In our stores, demand for higher‑quality, higher-value categories, such as service counter items, fruit and vegetables, and premium ready meals, grew in the latter half of the year. Online grocery sales continued to grow.
Market shares
GROCERY TRADE
Kesko’s market share in Finland was 33.5% (Kesko’s own estimate based on Nielsen’s comparison group, which also includes discount stores and service stations). K Group is the second biggest operator in Finnish grocery trade. Our market share decreased in 2025 due to changes in our operating environment and consumer behaviour. Competitors: Prisma, S-market, Alepa/Sale and Food Market Herkku, ABC (S Group), Lidl, Tokmanni, Minimani, Halpa-Halli, R-kioski and M-chain stores.
The market share for K-Citymarket’s home and speciality goods (non-food) cannot be reliably calculated. Competitors: hypermarkets, department stores, discounters, specialist chains, and Finnish and international online stores.
KESPRO FOODSERVICE
Kespro is the market leader in foodservice wholesale in Finland. Kespro’s market share is estimated to have strengthened in 2025 to 49.2% (in the Finnish Grocery Trade Association’s foodservice wholesale peer group). The market for eating out suffered from muted consumer confidence in 2025. The continued growth in Northern travel, especially by customers from abroad, had a positive impact on restaurant sales. In the long term, the market for eating out is expected to grow in Finland. Competitors: Meira Nova, Metro-tukku, Valio Aimo, Suomen Palvelutukkurit, and industrial direct deliveries and speciality wholesalers.
|
K Group's grocery trade |
Number of stores |
Retail and BtoB sales, VAT 0%, |
||
|
2025 |
2024 |
2025 |
Change, % |
|
|
K Foodstores |
1,117 |
1,128 |
6,675.3 |
1.1 |
|
K-Citymarket, non-food |
83 |
82 |
605.9 |
0.3 |
|
Kespro |
- |
- |
1,200.8 |
0.0 |
|
Grocery trade, total |
1,117 |
1,128 |
8,482.0 |
0.9 |
|
At the end of 2025 there were 83 K-Citymarket, 254 K-Supermarket, 721 K-Market and 59 other stores. In addition, 788 K Group grocery stores offered online grocery services. Kespro had 13 cash & carry outlets and an online outlet. |
||||
|
Key figures |
|
2025 |
2024 |
|
|
Net sales, € million |
|
6,447.4 |
6,381.4 |
|
|
Operating profit, comparable, € million |
|
418.1 |
438.0 |
|
|
Operating margin, comparable |
|
6.5 |
6.9 |
|
|
Return on capital employed, comparable, % |
|
14.1 |
16.0 |
|
|
Capital expenditure, € million |
|
309.2 |
276.0 |
|
|
Personnel, average |
|
6,264 |
6,346 |
|
|
Properties |
|
2025 |
2024 |
|
|
Owned properties, capital, € million |
|
1,389 |
1,206 |
|
|
Owned properties, area, 1,000 m² |
|
765 |
686 |
|
|
Leased properties, area, 1,000 m² |
|
1,587 |
1,394 |
|