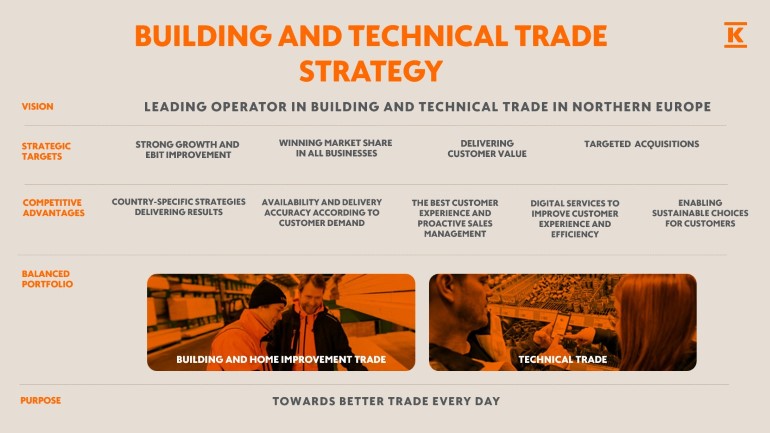
Building and technical trade strategy
The building and technical trade division operates in 8 countries: Finland, Sweden, Norway,Denmark, Estonia, Latvia, Lithuania and Poland. In the Baltics and Belarus, building and home improvement trade operations are handled by the joint venture Kesko Senukai. The division has some 460 stores and offers extensive online services via its chains: Onninen serves technical trade customers, while K-Rauta, Byggmakker and K-Bygg and Davidsen serve professional builders and consumers.
In the core of the strategy is strong growth and profitability, cash flow generation, profitable growth through targeted acquisitions and winning market share in all markets. We continue executing the country-specific business strategies. The division serves technical professionals, professional builders and consumers and the aim is to offer the best customer experience and digital services.

Strategic objectives
- Strong growth and profit performance
- Improved profitability
- Targeted acquisitions
- Winning over market share in all markets
Competitive advantages
- Country-specific strategies delivering results
- Availability and delivery accuracy aligned with customer needs
- The best customer experience and proactive sales
- Digital services to improve customer experience and efficiency
- Enabling more sustainable choices for customers
Business environment
Economic cycles
- Interest rates impacting investment appetites
- Operating environment expected to improve in 2026
- Market situation creates opportunities for industry consolidation
Green transition
- Growing need for energy boosting demand for energy solutions
- Increased investments in energy infrastructure
- Fast development of green transition-related technologies
Renovation building
- Investment debt related to infrastructure and other construction
- Need for renovation growing steadily
Urbanisation
- Urbanisation driving growing demand for construction
- Growing need for infrastructure investments in e.g. electric grid and water and sewage networks
Digitalisation and technologisation
- Increasing use of smart technical solutions in building and construction
- Digitalisation and AI improving efficiency and the customer experience

Read more about the country specific achievements and strategy in Kesko's Annual Report.
Market areas and market shares

Markets
Gradual recovery has continued in the construction cycle, but the pace has been slower than anticipated, especially in new housing construction. Reasons behind the trend include weak consumer confidence, increased savings, and excess supply in housing, with factors varying somewhat between the countries. Depending on the operating country, new housing construction accounts for some 20–30% of the total construction market. Other forms of construction, such as infrastructure construction and renovation building, declined less than housing construction.
In the longer term, the total construction market is supported by renovation building, construction related to energy efficiency and the green transition, urbanisation, and demographic changes in Northern Europe. Building and construction becoming increasingly technical, tightening requirements, and growing infrastructure investment debt also underpin construction.
The total market for Kesko’s existing building and technical trade operations in our current market areas totalled approximately €31.6 billion in 2025 (€31.1 billion in 2024).
Growth potential in acquisitions
The Northern European market continues to offer good growth potential also in the form of acquisitions. The building and technical trade markets are fragmented in many of our Northern European operating countries, and thus there is excellent potential to continue active sector consolidation. Currently our market share is still relatively low in, for example, Sweden, which suggests potential for continued growth also via acquisitions in line with our strategy. Denmark also holds further potential for us especially in technical trade.
Information based on Kesko’s estimates.
|
K Group’s building and technical trade |
Number of stores |
Retail and B2B sales, VAT 0%, € million |
||
|
2025 |
2024 |
2025 |
Change, %* |
|
|
K-Rauta, Finland |
125 |
122 |
1,093.7 |
1.2 |
|
K-Rauta B2B Service, Finland |
- |
- |
218.2 |
1.5 |
|
Technical trade, Finland |
60 |
60 |
1,093.3 |
-1.3 |
|
Finland total |
185 |
182 |
2,405.2 |
0.1 |
|
K-Bygg, Sweden |
57 |
56 |
350.1 |
0.4 |
|
Technical trade, Sweden |
5 |
5 |
122.5 |
-1.5 |
|
Byggmakker, Norway |
89 |
90 |
606.9 |
0.8 |
|
Technical trade, Norway |
26 |
26 |
543.4 |
1.1 |
|
Davidsen, Denmark |
49 |
23 |
843.1 |
2.9 |
|
Technical trade, Baltia |
18 |
18 |
153.6 |
20.8 |
|
Technical trade, Poland |
29 |
30 |
378.1 |
2.8 |
|
Other countries, total |
273 |
248 |
2,997.6 |
2.4 |
|
Building and technical trade, total |
458 |
430 |
5,402.7 |
1.4 |
|
In addition, building and technical trade stores offer extensive e-commerce services to their customers. Two Onninen stores in Finland operate on the same store premises with K-Rauta.
|
||||
|
Key figures |
|
2025 |
2024 |
|
|
Net sales, € million |
4,685.8 |
4,351.6 |
||
|
Building and home improvement trade |
2,471.9 |
2,160.7 |
||
|
Technical trade |
2,285.4 |
2,255.0 |
||
|
Operating profit, comparable, € million |
178.6 |
169.1 |
||
|
Building and home improvement trade |
75.3 |
57.9 |
||
|
Technical trade |
89.4 |
90.5 |
||
|
Kesko Senukai |
19.5 |
20.9 |
||
|
Operating margin, comparable, % |
3.8 |
3.9 |
||
|
Building and home improvement trade |
3.0 |
2.7 |
||
|
Technical trade |
3.9 |
4.0 |
||
|
Return on capital employed, comparable, % |
7.3 |
7.8 |
||
|
Capital expenditure, € million |
279.7 |
293.7 |
||
|
Personnel, average |
6,853 |
6,538 |
||
|
Properties |
|
2025 |
2024 |
|
|
Owned properties, capital, € million |
|
580 |
248 |
|
|
Owned properties, area, 1,000 m² |
|
715 |
356 |
|
|
Leased properties, area, 1,000 m² |
|
999 |
869 |
|