Frontpage ![]() Year 2009
Year 2009 ![]() Year 2009 in brief
Year 2009 in brief
The deterioration in the general economic situation in 2009 affected sales particularly in Kesko’s car and machinery trade and in the building and home improvement trade. Sales growth remained stable in the food trade.
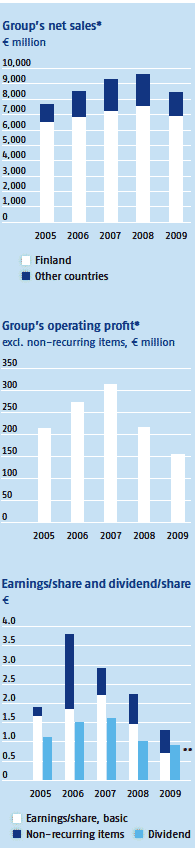
Net sales decreased by 11.9% from the previous year. In Finland, net sales dropped by 7.5% and in other countries by 28.1%.
The K-Group’s sales (incl. VAT) to retail and B2B customers were €12,614 million, representing a decrease of 9.1% from the previous year.
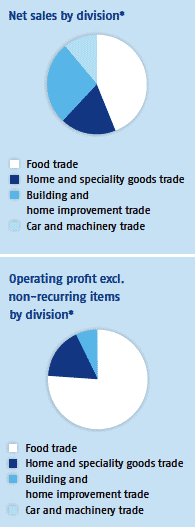
Net sales in the food segment increased by 2.4% and the grocery sales of K-food stores increased by 5.6% (VAT 0%) from the previous year. The sales growth of Pirkka products was particularly good. The K-citymarket’s sales also performed well and showed an increase of 14.3% in food sales.
Net sales in the home and speciality goods segment decreased by 3.0%. Sales of home electronics and interior decoration items suffered from the weaker economic situation and growing unemployment. Towards the end of the year, however, sales started to pick up. Sales of clothing and sports items increased in particular and Christmas sales were very successful.
In the building and home improvement segment, net sales dropped by 22.4%. In Finland, the decline in net sales can be mainly attributed to the drop in B2B sales. In other countries, the decrease in net sales resulted from lower demand and the weakening of the Swedish krona, the Norwegian krone, and the Russian rouble. The construction market declined substantially in the Nordic and Baltic countries, and in Russia.
In the car and machinery trade, the market remained difficult and net sales decreased by 36.0%. The demand for cars dropped, but Audi, Volkswagen and Seat succeeded in increasing their market share to 18.5% (17.1%). The number of orders grew towards the end of the year. Konekesko’s net sales dropped due to the weakened machinery market and the discontinuation of the Baltic grain and agricultural supplies trade.
Operating profit excluding non-recurring items amounted to €155.4 million (€217.0 million). Non-recurring items totalled €77 million and they include a €93 million gain on the sale of properties. Non-recurring expenses include a €14.4 million impairment charge on properties.
The decrease in the operating profit excluding non-recurring items compared with the previous year can be attributed to weakened demand in the building and home improvement trade in particular and in the car and machinery trade.
Kesko has decided to transfer management of the statutory pension provision and the insurance portfolio to Ilmarinen Mutual Pension Insurance Company in two phases, starting 1 June 2010. The Kesko Pension Fund’s statutory employee pension insurance (department B) covers about 8,700 people, and the first phase of the transfer will concern some 3,600 people. The transfer is estimated to have a positive effect on Kesko’s cash flow. The transfer is subject to the approval of the Financial Supervisory Authority and the Finnish Competition Authority. The second phase will be implemented at the beginning of 2012 at the earliest.
The number of shareholders totalled 38,888 at the end of 2009, an increase of 808 from the beginning of the year. Foreign shareholders owned 30% of the B shares at the end of 2009.
| Key figures | 2009 | 2008 | Muutos | ||
| Net sales* | € million | 8,447 | 9,591 | -11.9 | % |
| Operating profit* | € million | 232 | 286 | -18.7 | % |
| Operating profit excl. non-recurring items* |
€ million | 155 | 217 | -28.4 | % |
| Profit before tax* | € million | 217 | 289 | -24.9 | % |
| Return on capital employed | % | 11.0 | 15.2 | -4.2 | pp |
| Return on equity | % | 6.6 | 12.1 | -5.5 | pp |
| Cash flow from operating activities | € million | 379 | 131 | (..) | |
| Investments* | € million | 198 | 338 | -41.5 | % |
| Equity ratio | % | 54.1 | 52.4 | 1.8 | pp |
| Gearing | % | -12.5 | 2.3 | -14.8 | pp |
| Dividend per share | € | 0.90** | 1.00 | -10.0 | % |
| Earnings per share, diluted | € | 1.27 | 2.24 | -43.1 | % |
| Equity per share, adjusted | € | 20.39 | 20.09 | 1.5 | % |
| Personnel, average* | 19,184 | 21,327 | -10.0 | % | |
| *continuing operations **proposal to the AGM (..) change over 100% | |||||