Frontpage ![]() Financial Statements,
Financial Statements, ![]() Report by the Board of Directors
Report by the Board of Directors
Report by the board of directors
Financial performance
Net sales and profit 2011
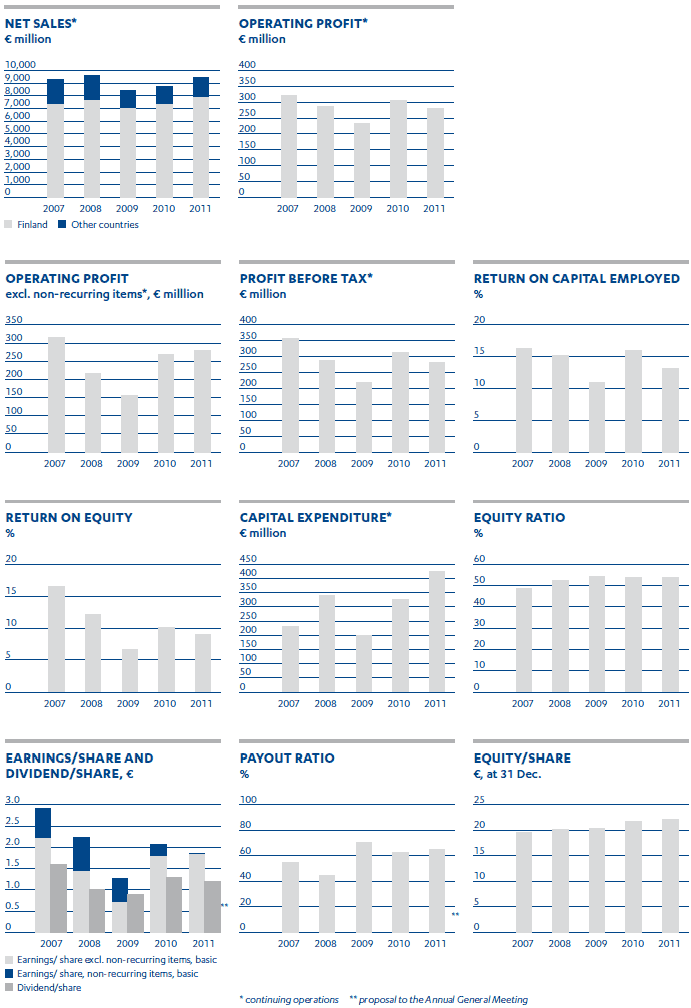
The Group’s net sales were €9,460 million, which is 7.8% up on the corresponding period of the previous year (€8,777 million). In Finland, net sales increased by 7.3% and in other countries by 10.1%. International operations accounted for 17.1% (16.7%) of the net sales. Net sales continued to grow steadily in the food trade, the building and home improvement trade and the car and machinery trade.
| 1–12/2011 | Net sales, M€ | Change, % |
Operating profit excl. non-recurring items, M€ |
Change, M€ | |
| Food trade | 4,182 | +7.3 | 172.2 | +12.1 | |
| Home and speciality goods trade | 1,564 | -0.3 | 36.6 | -29.4 | |
| Building and home improvement trade | 2,716 | +7.8 | 26.6 | +2.6 | |
| Car and machinery trade | 1,174 | +23.0 | 51.8 | +18.7 | |
| Common operations and eliminations | -176 | +8.2 | -8.3 | +6.7 | |
| Total | 9,460 | +7.8 | 278.9 | +10.8 |
The operating profit excluding non-recurring items was €278.9 million (€268.1 million), representing 2.9% (3.1%) of the net sales. Profitability improved in the car and machinery trade, the food trade and the building and home improvement trade. The operating profit excluding non-recurring items for 2010 was improved by an €8 million amount recognised as revenue in connection with the transfer of the pension insurance portfolio. At the beginning of the year, the principle for allocating surplus amounts related to the additional defined benefit obligation of the Kesko Pension Fund to divisions was changed to correspond to the breakdown of pension liabilities. For 2011, the change contributed €-1.7 million to the operating profit excluding non-recurring items in the food trade, and €-4.0 million in the home and speciality goods trade.
Operating profit was €280.6 million (€306.7 million). The operating profit includes a €1.7 million amount of non-recurring items. The comparative period included a net total of €38.6 million of non-recurring gains on real estate disposals and provisions related to the reorganisation of the service station grocery store business of Pikoil Oy, a Kesko Food subsidiary. The Group’s profit before tax was €282.1 million (€312.4 million).
The Group’s earnings per share were €1.84 (€2.06). The Group’s equity per share was €22.20 (€21.81).
The K-Group’s (i.e. Kesko’s and the chain stores’) retail and B2B sales (VAT 0%) were €11,767 million, up 7.2% compared to the previous year. K-food stores’ grocery sales grew by 5.9% (VAT 0%). The K-Group chains’ sales entitling to
Finance
The cash flow from operating activities was €215.7 million (€438.2 million). The cash flow of the comparative period included a €151.6 million amount of returned pension assets. The cash flow from investing activities was €-441.1 million (€-239.6 million). It included a €8.2 million (€123.6 million) amount of proceeds from the sale of fixed assets.
The Group’s liquidity and solvency remained at an excellent level despite a heavy capital expenditure programme. At the end of the period, liquid assets totalled €367 million (€847 million). Interest-bearing liabilities were €400 million (€477 million) and interest-bearing net debt €33 million (€-370 million) at the end of 2011. Equity ratio was 53.9% (53.5%) at the end of the period. Kesko Corporation increased the Group’s financial resources by signing two €50 million five-year loan facilities in November.
The Group’s net finance income was €0.8 million (€6.0 million).
Taxes
The Group’s taxes were €85.2 million (€96.7 million). The effective tax rate was 30.2% (31.0%), affected by loss-making foreign operations.
Capital expenditure
The Group’s capital expenditure totalled €425.4 million (€325.3 million), or 4.5% (3.7%) of the net sales. Capital expenditure in store sites was €361.8 million (€209.2 million), in acquisitions €21.8 million and other capital expenditure was €41.8 million (€116.0 million). Capital expenditure in foreign operations represented 31.7% (13.1%) of total capital expenditure.
Personnel
The average number of employees in the Kesko Group was 18,960 (18,215) converted into full-time employees. In Finland, the average increase was 141 people, while outside Finland, it was 604.
At the end of 2011, the total number of employees was 23,375 (22,124), of whom 13,124 (12,720) worked in Finland and 10,251 (9,404) outside Finland. Compared to the end of 2010, there was an increase of 404 people in Finland and 847 people outside Finland.
The Group’s staff cost was €570.5 million, an increase of 9.6% compared to the previous year. The staff cost for the comparative period was decreased by the €8.0 million amount recognised as revenue in connection with the transfer of the pension insurance portfolio.
Segments
Seasonal nature of operations
The Group’s operating activities are affected by seasonal fluctuations. The net sales and operating profits of the reportable segments are not earned evenly throughout the year. Instead, they vary by quarter depending on the characteristics of each segment.
Food trade
| 1–12/2011 | 1–12/2010 | |
| Net sales, € million | 4,182 | 3,896 |
| Operating profit excl. non-recurring items, € million |
172.2 | 160.1 |
| Operating profit as % of net sales excl. non-recurring items |
4.1 | 4.1 |
| Capital expenditure, € million | 221.5 | 117.2 |
| Net sales, € million | 1–12/2011 | Change, % |
| Sales to K-food stores | 3,251 | +8.4 |
| Kespro | 740 | +7.5 |
| Others | 191 | -8.6 |
| Total | 4,182 | +7.3 |
In the food trade, net sales were €4,182 million (€3,896 million), up 7.3%. The sales of Pirkka products to K-food stores were excellent, with sales growth standing at 32.3% (VAT 0%). During the same period, the grocery sales of K-food stores increased by 5.9% (VAT 0%). Good sales performance was achieved especially by the
The operating profit excluding non-recurring items of the food trade was €172.2 million (€160.1 million), or €12.1 million up on the previous year. The profitability improvement is attributable to K-food stores’ and Kespro’s good sales performance and cost management. Operating profit was €173.7 million (€158.4 million). The non-recurring items of the comparative period totalled €-1.7 million including gains on real estate disposals and provisions for the reorganisation of the service station grocery store business of Pikoil Oy, a Kesko Food subsidiary, as the most significant items.
Capital expenditure in the food trade was €221.5 million (€117.2 million), of which capital expenditure in store sites was €211.3 million (€102.4 million).
The most significant store sites being built are
Home and speciality goods trade
| 1–12/2011 | 1–12/2010 | |
| Net sales, € million | 1,564 | 1,569 |
| Operating profit excl. non-recurring items, € million |
36.6 | 66.0 |
| Operating profit as % of net sales excl. non-recurring items |
2.3 | 4.2 |
| Capital expenditure, € million | 61.8 | 45.3 |
| Net sales, € million | 1–12/2011 | Change, % |
| 642 | +3.5 | |
| Anttila | 474 | -6.0 |
| Intersport, Finland | 170 | -2.0 |
| Intersport, Russia | 7 | - |
| Indoor | 178 | +15.3 |
| Musta Pörssi | 74 | -23.2 |
| Kenkäkesko | 23 | -0.1 |
| Total | 1,564 | -0.3 |
In the home and speciality goods trade, net sales were €1,564 million (€1,569 million), down 0.3%.
The operating profit excluding non-recurring items of the home and speciality goods trade was €36.6 million (€66.0 million), showing a €29.4 million year-on-year decrease. In addition to a decrease in Anttila’s sales, profitability was weakened by the launch of Anttila’s new logistics centre, the reform of
Capital expenditure in the home and speciality goods trade was €61.8 million (€45.3 million).
The acquisition of Intersport operations in Russia progressed according to plan. By 31 December 2011, 36 stores had transferred to the Kesko subsidiary. In the future, the objective is to double the Intersport store site network in Russia by the end of 2015.
Building and home improvement trade
| 1–12/2011 | 1–12/2010 | |
| Net sales, € million | 2,716 | 2,519 |
| Operating profit excl. non-recurring items, € million |
26.6 | 24.0 |
| Operating profit as % of net sales excl. non-recurring items |
1.0 | 1.0 |
| Capital expenditure, € million | 109.8 | 78.2 |
| Net sales, € million | 1–12/2011 | Change, % |
| Rautakesko Finland | 1,233 | +6.0 |
| 215 | +3.3 | |
| Byggmakker Norway | 592 | +8.2 |
| Rautakesko Estonia | 59 | +13.6 |
| Rautakesko Latvia | 53 | +11.1 |
| Senukai Lithuania | 249 | +9.8 |
| Stroymaster Russia | 237 | +16.4 |
| OMA Belarus | 80 | +9.2 |
| Total | 2,716 | +7.8 |
In the building and home improvement trade, net sales were €2,716 million (€2,519 million), up 7.8%. Sales performance and structure vary between countries and customer groups. There is also material variation between the sales performances of product lines, with strongest growth in building materials.
Net sales in Finland were €1,233 million (€1,163 million), an increase of 6.0%. The building and home improvement product lines contributed €892 million to the net sales in Finland, an increase of 5.9%. The agricultural supplies trade contributed €341 million to the net sales, up 6.4%.
The net sales from foreign operations in the building and home improvement trade were €1,483 million (€1,357 million), an increase of 9.3%. The net sales from foreign operations increased by 12.6% in terms of local currencies. In Sweden, net sales were down by 2.2% in terms of kronas. In Norway, net sales increased by 5.3% in terms of krones. In Russia, net sales increased by 18.2% in terms of roubles. In Belarus, net sales were up by 101.6% in terms of roubles due to high inflation. Foreign operations contributed 54.6% to the net sales of the building and home improvement trade.
The operating profit excluding non-recurring items of the building and home improvement trade was €26.6 million (€24.0 million), up €2.6 million compared to the previous year. The profit performance was impacted by the sales growth mainly deriving from basic building materials with low margins, the expansion of store network and by the costs related to the introduction and development of the international enterprise resource planning system. Operating profit was €26.3 million (€23.9 million).
Capital expenditure in the building and home improvement trade totalled €109.8 million (€78.2 million), of which 85.8% (54.4%) abroad. Capital expenditure in store sites was 89.3%.
During the year in Finland, a new
The retail sales of the
Car and machinery trade
| 1–12/2011 | 1–12/2010 | |
| Net sales, € million | 1,174 | 955 |
| Operating profit excl. non-recurring items, € million |
51.8 | 33.1 |
| Operating profit as % of net sales excl. non-recurring items |
4.4 | 3.5 |
| Capital expenditure, € million | 29.9 | 17.8 |
| Net sales, € million | 1–12/2011 | Change, % |
| VV-Auto | 849 | +27.0 |
| Konekesko | 326 | +13.6 |
| Total | 1,174 | +23.0 |
The net sales of the car and machinery trade were €1,174 million (€955 million), up 23.0%. The comparable net sales of the car and machinery trade grew by 26.0%. The discontinued Baltic grain and agricultural inputs trade has been eliminated from the comparable net sales.
VV-Auto’s net sales were €849 million (€668 million), an increase of 27.0%. In Finland, new registrations of passenger cars increased by 12.6% and those of vans by 31.2% compared to the previous year. The combined market share of passenger cars and vans imported by VV-Auto was 20.7% (19.3%). Volkswagen was the best selling passenger car and van brand in Finland.
Konekesko’s net sales were €326 million (€287 million), up 13.6% compared to the previous year. Konekesko’s comparable net sales, from which the discontinued Baltic grain and agricultural inputs trade has been eliminated, grew by 23.5%. Net sales in Finland were €219 million, up 13.3%. The net sales from Konekesko’s foreign operations were €111 million, up 14.7%. Konekesko’s comparable net sales growth was attributable to the good performance of the agricultural machinery trade in the Baltic countries.
The operating profit excluding non-recurring items of the car and machinery trade was €51.8 million (€33.1 million), up €18.7 million compared to the previous year. The strong profit was attributable to excellent sales performance. The operating profit was €51.9 million (€33.9 million).
Capital expenditure in the car and machinery trade was €29.9 million (€17.8 million).
Changes in the Group composition
Kesko established a new subsidiary in Russia for Russian Intersport operations, in which Kesko Corporation’s and Melovest Ltd’s ownership interests are 80% and 20% respectively. The acquisition of Intersport operations in Russia was concluded on 24 August, 2011. By 31 December 2011, 36 stores had been transferred to the Kesko subsidiary.
Resolutions of the 2011 Annual General Meeting and decisions of the Board’s organisational meeting
Kesko Corporation’s Annual General Meeting, held on 4 April 2011, adopted the financial statements for 2010 and discharged the Board members and the Managing Director from liability. The General Meeting also resolved to distribute €1.30 per share as dividends, or a total of €128,233,679.60, as proposed by the Board of Directors. The dividend pay date was 14 April 2011. The General Meeting also resolved to leave the number of Board members unchanged at seven, elected PricewaterhouseCoopers Oy as the company’s auditor, with APA Johan Kronberg as the auditor with principal responsibility, and approved the Board’s proposals to authorise the Board to acquire a total maximum of 1,000,000 own B shares, and to issue a total maximum of 1,000,000 own B shares held by the company itself. The General Meeting also approved the Board’s proposal to decide in 2011 on the donation of a total maximum of €300,000 for charitable or corresponding purposes.
The organisational meeting of Kesko Corporation’s Board of Directors, held after the Annual General Meeting, decided to maintain the compositions of the Board’s Audit Committee and Remuneration Committee unchanged.
More detailed information on the resolutions of the 2011 Annual General Meeting and on the decisions of the Board’s organisational meeting was given in stock exchange releases on 4 April 2011.
Shares, securities market and Board authorisations
At the end of 2011, the total number of Kesko Corporation shares was €98,645,042, of which 31,737,007, or 32.2%, were A shares and 66,908,035, or 67.8%, were B shares. At 31 December 2011, Kesko Corporation held 700,000 own B shares. Each A share entitles to ten (10) votes and each B share to one (1) vote. The company cannot vote with own shares held by it. At the end of 2011, Kesko Corporation’s share capital was €197,282,584. During the reporting period, the number of B shares was increased twice to correspond to share subscriptions with the option rights of the 2007 option scheme. The increases were made on 31 May 2011 (2,750 B shares) and on 1 August 2011 (1,000 B shares) and announced in a stock exchange notification on the same days. The subscribed shares were listed for public trading on NASDAQ OMX Helsinki (the Helsinki stock exchange) with the old B shares on 1 June 2011 and 2 August 2011. The combined share subscription price of €87,637.50 received by the company was recorded in the reserve of invested non-restricted equity.
The price of a Kesko A share quoted on NASDAQ OMX Helsinki was €34.70 at the end of 2010, and €24.82 at the end of 2011, representing a decrease of 28.5%. Correspondingly, the price of a B share was €34.93 at the end of 2010, and €25.96 at the end of 2011, representing a decrease of 25.7%. In 2011 the highest A share price was €36.00 and the lowest was €22.35. For B share, they were €35.97 and €22.21 respectively. In 2011 the Helsinki stock exchange (OMX Helsinki) All-Share index fell by 30.1%, the weighted OMX Helsinki CAP index by 28.0%, while the Consumer Staples Index was down by 24.3%.
At the end of 2011, the market capitalisation of A shares was €788 million, while that of B shares was €1,719 million, excluding the shares held by the parent company. The combined market capitalisation of A and B shares was €2,506 million, a decrease of €932 million from the end of 2010. In 2011, a total of 2.1 million A shares were traded on the Helsinki stock exchange at a total value of €62 million, while 63.3 million B shares were traded at a total value of €1,856 million. The Helsinki stock exchange performed 79% of all Kesko share trades in 2011. In addition, Kesko shares were traded on multilateral trading facilities, the most significant of which were Chi-X, BATS and Turquoise, performing 12%, 5% and 3% of all Kesko share trades respectively (source: NASDAQ OMX).
The company operates the 2007 stock option scheme for management and other key personnel, under which the share subscription period of 2007A option rights runs from 1 April 2010 to 30 April 2012, that of 2007B option rights from 1 April 2011 to 30 April 2013, and that of 2007C option rights will begin on 1 April 2012 and end on 30 April 2014. The 2007A and 2007B option rights have also been included on the official list of the Helsinki stock exchange since the beginning of the share subscription periods. A total of 221,662 2007A option rights were traded during the reporting period at a total value of €184,113. A total of 102,410 2007B option rights were traded during the reporting period at a total value of €1,081,731.
The Board of Directors was authorised by the Annual General Meeting of 4 April 2011 to acquire a total maximum of 1,000,000 own B shares. The authorisation is valid until 30 September 2012. The Annual General Meeting also authorised the Board to decide on the issuance of a maximum of 1,000,000 own B shares held by the company itself. The authorisation is valid until 30 June 2014. The prior authorisation by the Annual General Meeting of 30 March 2009 to issue a maximum of 20,000,000 new B shares against payment or other consideration until 30 March 2012 is still valid. The authorisation has not been used. By virtue of the share acquisition authorisation, a total of 700,000 own B shares were acquired from the Helsinki stock exchange during the reporting period. The beginning of acquisition was announced on a stock exchange release on 28 April 2011. Each subsequent acquisition was announced in a stock exchange notification on the same day. No company shares have been issued by virtue of the share issue authorisations during the reporting period. Further information on the Board’s authorisations is available at www.kesko.fi/en.
At the end of 2011, the number of shareholders was 41,215, which is 2,957 more than at the end of 2010. At the end of 2011, foreign ownership of all shares was 20%, and foreign ownership of B shares was 29%.
Flagging notifications
Kesko Corporation did not receive flagging notifications during the reporting period.
Main events during the reporting period
Merja Haverinen, M.Soc.Sc., was appointed Kesko Corporation’s Senior Vice President for Corporate Communications and Responsibility starting from 1 April 2011. Paavo Moilanen, Senior Vice President for Corporate Communications and Responsibility, retired on 1 April 2011 in accordance with his service contract. (Stock exchange release on 4 February 2011)
Kesko’s Annual General Meeting was held on Monday, 4 April 2011. President and CEO Matti Halmesmäki announced in his review that Kesko Food will open four large-scale grocery stores in Russia in 2012–2013. Kesko Food’s objective is to achieve €500 million in net sales and a positive operating result in Russia by 2015. The capital expenditure is estimated at €300 million in 2011–2015. At the same time with new construction, Kesko Food will continue to explore business acquisition opportunities in both St. Petersburg and Moscow. (Stock exchange release on 4 April 2011)
On 4 April 2011, Kesko’s Board of Directors decided to introduce a new share-based compensation plan for some 150 Kesko management personnel and other named key personnel, in which a maximum of 600,000 own B shares held by the company can be granted to people in the target group within a period of three years. The purpose of the plan is to promote Kesko’s business operations and to increase the company’s value by combining the objectives of the shareholders and the management personnel. The plan encourages its participants to commit to the Kesko Group and provides them with the opportunity to receive company shares, if the targets set in the share-based compensation plan are achieved. The share-based compensation plan includes three vesting periods, namely the calendar years 2011, 2012 and 2013. A commitment period of three calendar years following each vesting period is attached to the shares issued in compensation, during which shares must not be transferred. (Stock exchange release on 4 April 2011)
Kesko Corporation’s Board of Directors agreed to extend the term of Kesko Corporation’s Managing Director and Kesko Group’s President and CEO Matti Halmesmäki until the end of May 2015, when Mr. Halmesmäki will be 63. According to the previous agreement, Mr. Halmesmäki’s term would have expired in May 2012. (Stock exchange release on 25 May 2011)
Kesko signed agreements on the transfer of the Intersport licence in Russia to Kesko with Intersport International and Intersport CIS. According to the letter of intent signed on the same occasion, Kesko established a new company for Intersport operations in Russia together with Melovest, the owner of Intersport CIS. Melovest holds a 20% ownership interest in the new company. The acquisition of Intersport operations in Russia was concluded and the subsidiary established for the purpose started operating in August 2011. (Stock exchange releases on 3 June 2011 and 24 August 2011)
Jari Lind, Rautakesko Ltd’s President and a member of Kesko’s Corporate Management Board, resigned on 9 June 2011. During the recruitment process of a new president, Antti Ollila, Vice President for Rautakesko Commerce, was in charge ad interim of the duties of the Rautakesko President. In consequence of Lind’s resignation, his membership of Kesko’s Corporate Management Board ended. (Stock exchange release on 9 June 2011)
Kesko’s Corporate Management Board was revised. Arja Talma, 49, M.Sc. (Econ.), eMBA, was appointed President of Rautakesko Ltd and Corporate Management Board member responsible for Kesko’s building and home improvement trade with effect from 1 November 2011. Minna Kurunsaari, 46, LL.M., was appointed Kesko’s Corporate Management Board member responsible for the home and speciality goods trade with effect from 1 December 2011. Minna Kurunsaari’s responsibility area will also include Kesko’s electronic marketing and services projects. Jukka Erlund, 37, M.Sc. (Econ.), eMBA, was appointed Kesko Corporation’s Chief Financial Officer (CFO) and Kesko’s Corporate Management Board member with effect from 1 November 2011. (Stock exchange release on 26 October 2011)
Responsibility
Kesko was chosen for the seventh time for ‘The Global 100 Most Sustainable Corporations’ list. In 2011, Kesko was ranked 26th compared to 33rd in 2010.
SAM (Sustainable Asset Management) assessed Kesko’s performance in responsibility work and placed it in Silver Class in the Food & Drug Retailers sector of the SAM Sustainability Yearbook 2011. The assessment of companies in this sector included aspects such as health and nutrition, environmental systems, eco-efficiency of operations and standards of suppliers.
In September, Kesko was included in the Dow Jones sustainability indexes DJSI World and DJSI Europe for the ninth time. Kesko was given the highest scores in the sector for Customer Relationship Management and for Codes of Conduct/Compliance/Corruption&Bribery.
For the third time, Kesko was included as a member in the highly valued FTSE4Good index focusing on responsible investment in September. Kesko’s work for curbing climate change was given 5 points on a scale 0-5.
Kesko’s 2010 Corporate Responsibility Report was chosen Finland’s best, and was ranked the best also by students, in the Responsibility Reporting Competition in November.
Kesko distributed a total of €30,000 in awards to pioneers in sustainable development from the assets granted by the General Meeting for the Board’s donations. In addition, a €1,000 scholarship was granted to 42 talented young athletes and art students from those assets.
Kesko was the main partner of the Your Move Mega Event in Helsinki from 27 May to 1 June 2011. The event gathered over 42,000 13-19-year-olds from different parts of Finland.
In September, K-food stores’ transportation started testing a new type of double-decker lorry trailer which helps reduce the carbon dioxide emissions from transportation by one third.
Anttila’s new logistics centre was awarded the ISO 14001 certificate in November.
Information contained in the notes to
the financial statements
Information on the Group’s personnel is disclosed in note 8.
Information on options, shares under options and voting rights is disclosed in note 35.
Related party transactions are disclosed in note 40.
The Kesko Group is not engaged in significant research and development activities.
In May 2012, Kesko will publish a separate corporate responsibility report, which analyses the Group’s performance in economic, social and environmental responsibility. An assurance statement will be provided by an independent external party.
Risk management
Kesko’s risk management is proactive and an integral part of management and day-to-day activities. The objective of risk management is to ensure the delivery of customer promises in the Kesko Group, profit performance, dividend payment capacity, shareholder value, the implementation of responsible operating practices and the continuity of operations.
Risk management in the Kesko Group is guided by the risk management policy confirmed by the Board of Directors. The policy defines the objectives and principles, organisation, responsibilities and practices of risk management in the Kesko Group. The management of financial risks is based on the Group’s finance policy, confirmed by Kesko’s Board of Directors. The business division and Group managements are responsible for the execution of risk management.
The Kesko Group applies a business-oriented and comprehensive approach to risk assessment and management. This means that key risks are systematically identified, assessed, managed, monitored and reported at the Group, division, company and unit levels in all operating countries.
Kesko has a uniform risk assessment and reporting system. Risk identification is based on business objectives and opportunities and the defined risk appetite. Risks are prioritised on the basis of their significance by assessing the impact and probability of their materialisation and the level of risk management. When assessing the impact of materialisation, the impacts on reputation, employees’ wellbeing and the environment are considered in addition to financial impacts.
In connection with the strategy process, the divisions assess the risks and opportunities concerning each strategic period. Near-future risks are identified and assessed in accordance with the rolling planning framework. Risk assessment also covers the risks concerning each division’s subsidiaries and significant projects.
A division’s risk assessment, which includes risk management responses, responsible persons and schedules, is considered by the division’s management team or the division Board quarterly prior to the disclosure of the interim report. The Group functions assess the risks concerning their responsibility areas at least once a year.
Risks and management responses are reported in accordance with Kesko’s reporting responsibilities. The divisions report on risks and changes in risks to the Group’s risk management function on a quarterly basis. Risks are discussed by the risk reporting team including representatives of the divisions and the Group functions. On that basis, the Group’s risk management function prepares the Group’s risk map presenting the most significant risks and uncertainties and their management.
The Group’s risk map is reported to the Kesko Board’s Audit Committee in connection with considering the interim reports and the financial statements. The Chair of the Audit Committee reports on risk management to the Board as part of the Audit Committee’s report. The Kesko Board considers the Kesko Group’s most significant risks and uncertainties and their management responses, and assesses the efficiency and performance of risk management at least once a year. The most significant risks and uncertainties are reported to the market by the Board in the financial statements, and any material changes in them in the interim reports.
The following describes the risks and uncertainties assessed as significant.
Significant risks and uncertainties
The financial market falling into crisis and the uncertainty prevailing in the euro zone, increased taxes and public payments resulting from the indebtedness of the public sector, coupled with increasing unemployment are weakening the purchasing power and appetite for capital expenditure, as well as negatively impacting consumer confidence and demand especially in the home and speciality goods trade, the building and home improvement trade and the car and machinery trade.
In Russia, Kesko is strongly expanding its business operations in the building and home improvement trade and the sports trade and will open its first food stores. With regard to expansion, it is critical to succeed in the acquisition and building of good store sites, in the development of store concepts, in purchasing and logistics, and in the recruitment of key personnel. The country risks in Russia, such as corruption, the unpredictability of officials and rapid changes in legislation and the application of laws, as well as sudden changes in the operating environment can delay the expansion and complicate operating activities.
E-commerce is becoming increasingly popular, international e-commerce increases consumers’ alternatives and buying decisions are increasingly often made based on online information. The achievement of objectives requires both traditional and online concepts attractive to customers, a multi-channel approach and customer communications to support it.
The execution of changes in business operations requires increasingly sophisticated resource planning and information systems. Failure in the definition of changes, technology selection, change project management and implementation would delay the execution of changes in business operations.
The trading sector is characterised by increasingly complicated and long supply chains and a dependency on information systems, data communications and external service providers. Failures in information and payment systems or in other parts of the supply chain can cause significant losses in sales and weaken customer satisfaction.
For the purpose of increasing market share, good store sites are a key competitive factor. The acquisition of store sites can be delayed by zoning and permit procedures and the availability and pricing of sites. Considerable amounts of capital or lease liabilities are tied up in store properties for years. Resulting from changes in the market situation, there is a risk that a store site becomes unprofitable and that operations are discontinued while long-term liabilities remain.
Increasing regulations restricting competitive trading conditions are being imposed also by the European Union. Such a development would weaken the trading sector’s possibilities to serve customers and operate efficiently.
A failure in product safety control or in the quality assurance of the supply chain can result in financial losses, the loss of customer confidence or, in the worst case, a health hazard to customers.
In divisions strongly dependent on individual principals and suppliers, such as the car and machinery trade, ownership arrangements and changes in a principal’s or supplier’s strategy concerning product selections, pricing and distribution channel solutions can mean weakened competitiveness, decreased sales, or loss of business.
Crimes are increasingly committed through data networks and crime is becoming more professional. Failure especially in the protection of payment transactions and personal information can cause losses, claims for damages and endanger reputation. There is a risk that controls against such crime are not sufficient.
Different aspects of responsibility are increasingly important for customers. Possible failures of responsibility would weaken Kesko’s reputation. Kesko’s challenges in responsibility work include communicating its responsibility policies to suppliers, retailers and customers, and ensuring responsibility in the supply chain.
Non-compliance with legislation and agreements can result in fines, compensation for damages and other financial losses, and a loss of confidence and reputation.
Kesko’s objective is to produce and publish reliable and timely information. If some information published by Kesko proved to be incorrect or communications failed to meet regulations, it can result in losing investor and other stakeholder confidence and in possible sanctions.
Accidents, natural phenomena and epidemics can cause damages or business interruptions which cannot be prevented.
Other risks and uncertainties relating to profit performance are described in the Group’s future outlook.
Future outlook
Estimates of the future outlook for the Kesko Group’s net sales and operating profit excluding non-recurring items are given for the 12 months following the accounting period (1/2012–12/2012) in comparison with the 12 months preceding the accounting period (1/2011–12/2011).
Resulting from the problems of European economies and financial markets, the total production performance and consumer confidence have weakened, which is why significant uncertainties are associated with the outlook for consumer demand. In addition, cuts in public finances and tightening taxation may have a negative impact on the development of purchasing power and consumer demand.
The steady growth in the grocery trade is expected to continue. Growth in the home and speciality goods trade and the building and home improvement trade is expected to even out in line with the overall consumer demand. In the car and machinery trade, the market is expected to turn down, which is partly attributable to the Finnish car tax increase effective
1 April 2012.
The Kesko Group’s net sales are expected to grow during the next twelve months. Owing to the uncertainty about economic development and consumer demand, and the costs involved in the expansion of the store site network as well as expansion of business operations in Russia, we are prepared for the 2012 operating profit excluding non-recurring items to be lower than the 2011 operating profit excluding non-recurring items.
Proposal for profit distribution
The parent’s distributable profits are €1,101,552,277.88, of which the profit for the financial year is €100,553,189.98.
The Board of Directors proposes to the Annual General Meeting to be held on 16 April 2012 that the distributable profits be used as follows:
A dividend of €1.20 per share is paid on shares held outside the company at the date of dividend distribution. No dividend is paid on own shares held by the Company at the record date of dividend distribution.
At the date of the proposal for distributions of profits, 1 February 2012, a total of 97,945,042 shares were held outside the Company, amounting to a total dividend of €117,534,050.40.
Annual General Meeting
The Board of Directors decided to convene the Annual General Meeting at the Helsinki Fair Centre on 16 April 2012 at 13.00. Kesko Corporation will publish a notice of the Annual General Meeting at a later date.
Corporate Governance Statement
Kesko will publish a separate Corporate Governance Statement on week 12 on its website at www.kesko.fi/en.
The Group's key performance indicators
Group’s performance indicators
| Continuing operations | 2008 | 2009 | 2010 | 2011 | |
| Income statement | |||||
| Net sales | € million | 9,591 | 8,447 | 8,777 | 9,460 |
| Change in net sales | % | 3.3 | -11.9 | 3.9 | 7.8 |
| Staff cost | € million | 578 | 535 | 521 | 571 |
| Staff cost as percentage of net sales | % | 6.0 | 6.3 | 5.9 | 6.0 |
| Depreciation, amortisation and impairment | € million | 178 | 131 | 121 | 125 |
| Operating profit | € million | 286 | 232 | 307 | 281 |
| Operating profit as percentage of net sales | % | 3.0 | 2.8 | 3.5 | 3.0 |
| Operating profit excl. non-recurring items | € million | 217 | 155 | 268 | 279 |
| Operating profit excl. non-recurring items as percentage of net sales | % | 2.3 | 1.8 | 3.1 | 2.9 |
| Finance income and costs | € million | 1 | -16 | 6 | 1 |
| Income from associates | € million | 2 | 0 | 0 | 1 |
| Profit before tax | € million | 289 | 217 | 312 | 282 |
| Profit before tax as percentage of net sales | % | 3.0 | 2.6 | 3.6 | 3.0 |
| Income tax expense | € million | 90 | 82 | 97 | 85 |
| Profit for the year from continuing operations | € million | 178 | 125 | 205 | 182 |
| Profit for the year from discontinued operations | € million | 42 | 0 | 0 | 0 |
| Capital expenditure | € million | 338 | 198 | 325 | 425 |
| Capital expenditure as percentage of net sales | % | 3.5 | 2.3 | 3.7 | 4.5 |
| Personnel, average number for the year | 21,327 | 19,200 | 18,215 | 18,960 | |
| Personnel at 31 Dec. | 24,668 | 22,207 | 22,124 | 23,375 | |
| Earnings/share, diluted | € | 1.81 | 1.27 | 2.06 | 1.84 |
| Earnings/share, basic | € | 1.82 | 1.28 | 2.08 | 1.85 |
| Whole Group | 2008 | 2009 | 2010 | 2011 | |
| Profit for the year (incl. non-controlling interests) | € million | 240 | 134 | 216 | 197 |
| Profit for the year as percentage of net sales | % | 2.5 | 1.6 | 2.5 | 2.1 |
| Attributable to owners of the parent | € million | 220 | 125 | 205 | 182 |
| Attributable to non-controlling interests | € million | 21 | 9 | 11 | 15 |
| Cash flow from operating activities | € million | 131 | 379 | 438 | 216 |
| Cash flow from investing activities | € million | -46 | 31 | -240 | -441 |
| Profitability | |||||
| Return on equity | % | 12.0 | 6.6 | 10.1 | 8.9 |
| Return on equity excl. non-recurring items | % | 8.1 | 3.8 | 8.7 | 8.8 |
| Return on capital employed | % | 15.3 | 11.0 | 16.0 | 13.2 |
| Return on capital employed excl. non-recurring items | % | 10.2 | 7.4 | 14.0 | 13.1 |
| Interest-bearing net debt/EBITDA | 0.1 | -0.7 | -0.9 | 0.1 | |
| Funding and financial position | |||||
| Interest-bearing net debt | € million | 47.4 | -258.5 | -370.5 | 32.8 |
| Gearing | % | 2.3 | -12.5 | -16.8 | 1.5 |
| Equity ratio | % | 52.5 | 54.2 | 53.5 | 53.9 |
| Other indicators | |||||
| Capital expenditure | € million | 340 | 198 | 325 | 425 |
| Capital expenditure as percentage of net sales | % | 3.5 | 2.3 | 3.7 | 4.5 |
| Personnel, average number for the year | 21,529 | 19,200 | 18,215 | 18,960 | |
| Personnel at 31 Dec. | 24,668 | 22,207 | 22,124 | 23,375 | |
| Share performance indicators | |||||
| Earnings/share, diluted | € | 2.23 | 1.27 | 2.06 | 1.84 |
| Earnings/share, basic | € | 2.24 | 1.28 | 2.08 | 1.85 |
| Earnings/share, excl. non-recurring items, basic | € | 1.44 | 0.71 | 1.78 | 1.84 |
| Equity/share | € | 20.10 | 20.39 | 21.81 | 22.20 |
| Dividend/share | € | 1.00 | 0.90 | 1.30 | 1.20* |
| Payout ratio | % | 44.5 | 70.5 | 62.6 | 64.9* |
| Payout ratio excl. non-recurring items | % | 69.3 | 126.9 | 72.9 | 65.3* |
| Cash flow from operating activities/share, adjusted | € | 1.34 | 3.86 | 4.45 | 2.20 |
| Price/earnings ratio, (P/E), A share, adjusted | 9.85 | 18.55 | 16.82 | 13.55 | |
| Price/earnings ratio, (P/E), B share, adjusted | 7.97 | 18.14 | 16.93 | 14.14 | |
| Effective dividend yield, A share | % | 4.5 | 3.8 | 3.7 | 4.8* |
| Effective dividend yield, B share | % | 5.6 | 3.9 | 3.7 | 4.6* |
| Share price at 31 Dec. | |||||
| A share | € | 22.00 | 23.60 | 34.70 | 24.82 |
| B share | € | 17.80 | 23.08 | 34.93 | 25.96 |
| Average share price | |||||
| A share | € | 28.30 | 21.92 | 30.42 | 29.20 |
| B share | € | 23.51 | 19.18 | 29.83 | 29.36 |
| Market capitalisation at 31 Dec., A share | € million | 698 | 749 | 1,101 | 788 |
| Market capitalisation at 31 Dec., B share | € million | 1,176 | 1,537 | 2,337 | 1,719 |
| Turnover | |||||
| A share | million pcs | 1 | 1 | 4 | 2 |
| B share | million pcs | 121 | 78 | 53 | 63 |
| Relative turnover rate | |||||
| A share | % | 4.5 | 3.1 | 13.8 | 6.6 |
| B share | % | 183.3 | 117.4 | 78.8 | 94.6 |
| Diluted number of shares at 31 Dec. | thousand pcs | 98,256 | 98,382 | 99,121 | 98,919 |
| Yield of A share for the last five periods | % | 10.9 | 9.2 | 11.9 | -4.6 |
| Yield of B share | |||||
| For the last five periods | % | 12.9 | 10.3 | 12.6 | -4.3 |
| For the last ten periods | % | 11.7 | 14.9 | 20.6 | 16.9 |
| * proposal to the Annual General Meeting | |||||
Net sales by segment
| € million | 1–12/2011 | 1–12/2010 | Change-% |
| Food trade, Finland | 4,182 | 3,896 | 7.3 |
| Food trade, other countries* | - | - | - |
| Food trade total | 4,182 | 3,896 | 7.3 |
| - of which inter-segment sales | 168 | 162 | 4.1 |
| Home and speciality goods trade, Finland | 1,541 | 1,553 | -0.8 |
| Home and speciality goods trade, other countries* | 23 | 15 | 50.3 |
| Home and speciality goods trade total | 1,564 | 1,569 | -0.3 |
| - of which inter-segment sales | 20 | 23 | -15.8 |
| Building and home improvement trade, Finland | 1,233 | 1,163 | 6.0 |
| Building and home improvement trade, other countries* | 1,483 | 1,357 | 9.3 |
| Building and home improvement trade total | 2,716 | 2,519 | 7.8 |
| - of which inter-segment sales | 12 | 0 | (..) |
| Car and machinery trade, Finland | 1,064 | 859 | 23.8 |
| Car and machinery trade, other countries* | 110 | 96 | 15.4 |
| Car and machinery trade total | 1,174 | 955 | 23.0 |
| - of which inter-segment sales | 1 | 0 | (..) |
| Common operations and eliminations | -176 | -162 | 8.2 |
| Finland total | 7,844 | 7,309 | 7.3 |
| Other countries total* | 1,616 | 1,468 | 10.1 |
| Group total | 9,460 | 8,777 | 7.8 |
| * Net sales in countries other than Finland (..) Change over 100 % |
|||
Operating profit by segment
| € million | 1–12/2011 | 1–12/2010 | Change |
| Food trade | 173.7 | 158.4 | 15.4 |
| Home and speciality goods trade | 37.0 | 103.4 | -66.4 |
| Building and home improvement trade | 26.3 | 23.9 | 2.4 |
| Car and machinery trade | 51.9 | 33.9 | 18.0 |
| Common operations and eliminations | -8.3 | -12.8 | 4.4 |
| Group total | 280.6 | 306.7 | -26.1 |
Operating profit excl. non-recurring items by segment
| € million | 1–12/2011 | 1–12/2010 | Change |
| Food trade | 172.2 | 160.1 | 12.1 |
| Home and speciality goods trade | 36.6 | 66.0 | -29.4 |
| Building and home improvement trade | 26.6 | 24.0 | 2.6 |
| Car and machinery trade | 51.8 | 33.1 | 18.7 |
| Common operations and eliminations | -8.3 | -15.0 | 6.7 |
| Group total | 278.9 | 268.1 | 10.8 |
Group’s performance indicators by quarter |
||||||||
| 1–3/ 2010 |
4–6/ 2010 |
7–9/ 2010 |
10–12/ 2010 |
1–3/ 2011 |
4–6/ 2011 |
7–9/ 2011 |
10–12/ 2011 |
|
| Net sales, € million | 1,958 | 2,279 | 2,231 | 2,310 | 2,103 | 2,472 | 2,404 | 2,481 |
| Change in net sales, % | -3.0 | 6.4 | 4.6 | 7.3 | 7.4 | 8.5 | 7.8 | 7.4 |
| Operating profit, € million | 20.9 | 79.0 | 123.9 | 82.8 | 35.7 | 83.9 | 88.2 | 72.8 |
| Operating margin, % | 1.1 | 3.5 | 5.6 | 3.6 | 1.7 | 3.4 | 3.7 | 2.9 |
| Operating profit excl. non-recurring items, € million | 20.9 | 78.1 | 88.7 | 80.5 | 34.9 | 83.3 | 89.2 | 71.5 |
| Operating margin excl. non-recurring items, % | 1.1 | 3.4 | 4.0 | 3.5 | 1.7 | 3.4 | 3.7 | 2.9 |
| Finance income/costs, € million | 0.8 | -0.2 | 0.8 | 4.6 | -0.6 | 0.3 | 0.3 | 0.8 |
| Profit before tax, € million | 21.9 | 78.7 | 124.5 | 87.3 | 36.1 | 84.0 | 88.0 | 74.0 |
| Profit before tax, % | 1.1 | 3.5 | 5.6 | 3.8 | 1.7 | 3.4 | 3.7 | 3.0 |
| Return on capital employed, % | 4.4 | 16.1 | 26.4 | 17.5 | 7.2 | 16.0 | 16.4 | 12.8 |
| Return on capital employed excl. non-recurring items, % |
4.4 | 15.9 | 18.9 | 17.0 | 7.0 | 15.9 | 16.6 | 12.5 |
| Return on equity, % | 2.9 | 10.6 | 16.1 | 11.5 | 4.5 | 10.6 | 10.9 | 10.0 |
| Return on equity excl. non-recurring items, % | 2.9 | 10.5 | 11.1 | 11.2 | 4.4 | 10.6 | 11.1 | 9.8 |
| Equity ratio, % | 51.3 | 51.4 | 53.4 | 53.5 | 54.4 | 52.1 | 54.0 | 53.9 |
| Capital expenditure, € million | 42.0 | 45.7 | 35.9 | 201.6 | 64.1 | 130.5 | 126.3 | 104.5 |
| Earnings/share, diluted, € | 0.15 | 0.51 | 0.81 | 0.59 | 0.25 | 0.55 | 0.53 | 0.51 |
| Equity/share, € | 19.69 | 20.30 | 21.11 | 21.81 | 22.04 | 21.21 | 21.66 | 22.20 |
Net sales by segment |
||||||||
| € million | 1–3/ 2010 |
4–6/ 2010 |
7–9/ 2010 |
10–12/ 2010 |
1–3/ 2011 |
4–6/ 2011 |
7–9/ 2011 |
10–12/ 2011 |
| Food trade | 912 | 976 | 986 | 1,022 | 948 | 1,077 | 1,049 | 1,108 |
| Home and speciality goods trade | 355 | 334 | 378 | 501 | 348 | 339 | 376 | 501 |
| Building and home improvement trade | 495 | 712 | 687 | 625 | 570 | 757 | 731 | 657 |
| Car and machinery trade | 236 | 298 | 218 | 203 | 279 | 342 | 290 | 263 |
| Common operations and eliminations | -40 | -41 | -39 | -42 | -42 | -43 | -42 | -48 |
| Group total | 1,958 | 2,279 | 2,231 | 2,310 | 2,103 | 2,472 | 2,404 | 2,481 |
Operating profit by segment |
||||||||
| € million | 1–3/ 2010 |
4–6/ 2010 |
7–9/ 2010 |
10–12/ 2010 |
1–3/ 2011 |
4–6/ 2011 |
7–9/ 2011 |
10–12/ 2011 |
| Food trade | 31.7 | 42.2 | 47.3 | 37.2 | 42.1 | 45.9 | 45.7 | 40.0 |
| Home and speciality goods trade | 0.1 | 7.0 | 50.6 | 45.6 | -7.4 | 2.8 | 8.7 | 32.9 |
| Building and home improvement trade | -13.8 | 17.9 | 19.9 | -0.2 | -9.1 | 18.8 | 21.0 | -4.5 |
| Car and machinery trade | 6.4 | 15.0 | 8.6 | 3.9 | 12.2 | 19.7 | 13.0 | 7.0 |
| Common operations and eliminations | -3.4 | -3.2 | -2.5 | -3.7 | -2.2 | -3.3 | -0.2 | -2.6 |
| Group total | 20.9 | 79.0 | 123.9 | 82.8 | 35.7 | 83.9 | 88.2 | 72.8 |
Operating profit by segment excl. non-recurring items |
||||||||
| € million | 1–3/ 2010 |
4–6/ 2010 |
7–9/ 2010 |
10–12/ 2010 |
1–3/ 2011 |
4–6/ 2011 |
7–9/ 2011 |
10–12/ 2011 |
| Food trade | 31.7 | 42.1 | 49.5 | 36.8 | 41.4 | 45.8 | 46.4 | 38.6 |
| Home and speciality goods trade | 0.1 | 7.0 | 13.2 | 45.7 | -7.4 | 2.4 | 8.7 | 32.9 |
| Building and home improvement trade | -13.8 | 17.9 | 20.0 | -0.2 | -9.1 | 18.8 | 21.3 | -4.4 |
| Car and machinery trade | 6.4 | 14.1 | 8.7 | 3.9 | 12.2 | 19.6 | 13.0 | 7.0 |
| Common operations and eliminations | -3.4 | -3.1 | -2.8 | -5.7 | -2.2 | -3.3 | -0.2 | -2.6 |
| Group total | 20.9 | 78.1 | 88.7 | 80.5 | 34.9 | 83.3 | 89.2 | 71.5 |
Calculation of performance indicators |
|||
| Profitability | |||
| Return on equity, % | = | (Profit / loss before tax – income tax) | x 100 |
| Shareholders’ equity | |||
| Return on equity excl. non-recurring items, % |
= |
(Profit/loss adjusted for non-recurring items before tax – income tax adjusted for the tax effect of non-recurring items) |
x 100 |
| Shareholders’ equity | |||
| Return on capital employed, % | = | Operating profit | x 100 |
| (Non-current assets + inventories + receivables + other current assets – non-interest-bearing liabilities) for a 12 month average |
|||
| Return on capital employed excluding non-recurring items, % |
= | Operating profit excluding non-recurring items | x 100 |
| (Non-current assets + inventories + receivables + other current assets – non-interest-bearing liabilities) for a 12 month average |
|||
| EBITDA | = | Operating profit + depreciation and amortisation + impairments | |
Funding and financial position |
|||
| Equity ratio, % | = | Shareholders’ equity | x 100 |
| (Balance sheet total – prepayments received) | |||
| Gearing, % | = | Interest-bearing net debt | x 100 |
| Shareholders’ equity | |||
| Interest-bearing net debt/EBITDA | = | Interest-bearing net debt | |
| EBITDA | |||
Share performance indicators |
|||
| Earnings/share, diluted | = | Profit/loss – non-controlling interests | |
| Average number of shares adjusted for the dilutive effect of options | |||
| Earnings/share, basic | = | Profit/loss – non-controlling interests | |
| Average number of shares | |||
| Earnings/share excl. non-recurring items, basic |
= | Profit/loss adjusted for non-recurring items – non-controlling interests | |
| Average number of shares | |||
| Equity/share | = | Equity attributable to equity holders of the parent | |
| Basic number of shares at balance sheet date | |||
| Payout ratio, % | = | (Dividend/share) | x 100 |
| (Earnings/share) | |||
| Price/earnings ratio, (P/E) | = | Share price at balance sheet date | |
| (Earnings/share) | |||
| Effective dividend yield, % | = | (Dividend/share) | x 100 |
| Share price at balance sheet date | |||
| Market capitalisation | = | Share price at balance sheet date × number of shares | |
| Cash flow from operating activities/share | = | Cash flow from operating activities | |
| Average number of shares | |||
| Yields of A share and B share | = | Change in share price + annual dividend yield | |
Analysis of shareholding
Analysis of shareholding as at 31 Dec. 2011 |
||
| All shares | Number of shares | % of all shares |
| Non-financial corporations and housing corporations | 28,785,760 | 29.18 |
| Financial and insurance corporations | 5,238,693 | 5.31 |
| General government* | 10,085,573 | 10.22 |
| Households | 28,439,926 | 28.83 |
| Non-profit institutions** | 6,478,763 | 6.57 |
| Rest of the world | 961,666 | 0.97 |
| Nominee registered | 18,654,661 | 18.91 |
| Total | 98,645,042 | 100.00 |
10 largest shareholders by number of shares at 31 Dec. 2011 |
|||||
| Number of shares | % of shares | Number of votes | % of votes | ||
| 1. | Ilmarinen Mutual Pension Insurance Company | 3,573,257 | 3.62 | 6,182,915 | 1.61 |
| 2. | K-Retailers' Association | 3,514,958 | 3.56 | 34,781,930 | 9.05 |
| 3. | Vähittäiskaupan Takaus Oy | 3,491,771 | 3.54 | 27,148,568 | 7.06 |
| 4. | Kruunuvuoren Satama Oy | 2,635,046 | 2.67 | 26,350,460 | 6.86 |
| 5. | Valluga-sijoitus Oy | 1,340,439 | 1.36 | 13,404,390 | 3.49 |
| 6. | Kesko Pension Fund | 1,288,839 | 1.31 | 8,523,390 | 2.22 |
| 7. | Varma Mutual Pension Insurance Company | 1,130,986 | 1.15 | 1,130,986 | 0.29 |
| 8. | Tapiola Mutual Pension Insurance Company | 1,100,000 | 1.12 | 1,100,000 | 0.29 |
| 9. | Oy The English Tearoom Ab | 1,008,400 | 1.02 | 1,008,400 | 0.26 |
| 10. | Foundation for Vocational Training in the Retail Trade |
975,547 | 0.99 | 8,384,518 | 2.18 |
10 largest shareholders by number of votes at 31 Dec. 2011 |
|||||
| Number of shares | % of shares | Number of votes | % of votes | ||
| 1. | K-Retailers' Association | 3,514,958 | 3.56 | 34,781,930 | 9.05 |
| 2. | Vähittäiskaupan Takaus Oy | 3,491,771 | 3.54 | 27,148,568 | 7.06 |
| 3. | Kruunuvuoren Satama Oy | 2,635,046 | 2.67 | 26,350,460 | 6.86 |
| 4. | Valluga-sijoitus Oy | 1,340,439 | 1.36 | 13,404,390 | 3.49 |
| 5. | Kesko Pension Fund | 1,288,839 | 1.31 | 8,523,390 | 2.22 |
| 6. | Foundation for Vocational Training in the Retail Trade | 975,547 | 0.99 | 8,384,518 | 2.18 |
| 7. | Ilmarinen Mutual Pension Insurance Company | 3,573,257 | 3.62 | 6,182,915 | 1.61 |
| 8. | Food Paradise Oy | 389,541 | 0.39 | 3,895,410 | 1.01 |
| 9. | K-Food Retailers' Club | 384,617 | 0.39 | 3,846,170 | 1.00 |
| 10. | Heimo Välinen Oy | 362,000 | 0.37 | 3,431,000 | 0.89 |
| * General government, for example, municipalities, the provincial administration of Åland, authorised pension provider and social security funds ** Non-profit institutions, for example, foundations awarding scholarships, organisations safeguarding certain interests and various charitable associations. |
|||||
Management’s shareholdings
At the end of December 2011, Kesko Corporation’s Board members, the President and CEO and the corporations controlled by them held 229,720 Kesko Corporation A shares and 109,420 Kesko Corporation B shares, i.e. a total of 339,140, which represent 0.34% of the company’s share capital and 0.63% of voting rights.
At 31 December 2011, the President and CEO held 2,000 Kesko Corporation A shares and 10,000 Kesko Corporation B shares, which represent 0.01% of the company’s share capital and 0.01% of its voting rights. In addition, the President and CEO holds 130,000 share options.
If shares were subscribed for with the President and CEO’s share options, they would represent 0.13% of all shares and 0.03% of all voting rights.